RailYatri Train Delay Report for 2017
Train Delay Report: A data centric approach to delays
Train delays in India are no longer funny! The track record below shows an average 20% increase in delays in the last 2 years and the numbers are only increasing. This RailYatri report brings forth a data centric approach to slice and dice the performance of trains across India and perhaps a first step towards finding a solution.
RailYatri’s National Train Delay Index is the cumulative national average of delays in arrival of train at a station on its route. It is important to point out here that we have considered all the stations across country to calculate this index. This is different from the practice which Railways across the world wherein only the delay at the last station is considered to calculate the delay index. We believe that considering all the stations makes it more ‘consumer’ centric.
-
How do we collect the data?
The data based on ‘crowd-sourcing’ is collected by the travellers reporting through their mobile devices.
-
How frequently does RailYatri calculate “National Train Delay Index”?
While internally we keep track of train delays on an on-going basis, we publish the comprehensive delay report at the end of the year. As an example – the report below is for the past entire year 2017.
-
How accurate is the data used to calculate the delay index?
Once accumulated through crowd-sourcing, the data goes through rigorous cleansing algorithms which separates the ‘good data’ from the ‘bad data’. Based on the rigor which has gone into building these algorithms, today after 4 years of continuing to publish this report, we remain very confident of the data which we have.
To get the correct picture of the delay index, we have used the data only between January 15 to December 15 (11 months). The severe train delays during the period of December 15 – January 15 due to fog in the northern India tends to skew the year-wide delay index. So we publish the delay data during this fog month separately from the remaining 11 months.
-
Why publish “National Train Delay Index”?
Something which regularly affects the lives of the citizens of the country have an index to easily figure out if that particular ‘thing’ is on the rise, holding steady or reducing (which could be good or bad based on what is being measured). For example there are already indexes to measure happiness, pollution, crime, etc. Needless to say train delays, which is a very common problem associated with trains in India, adversely affects travellers like us. So it was important to start calibrating the severity of delays and then keep track of it over the years. It was equally important to look at this data by slicing and dicing it through various dimensions to see the impact of it. With this background, RailYatri has been crunching the delay data and publishing the findings over the last few years.
RailYatri Train Delay Report for 2017
-
RailYatri’s National Train Delay Index for 2017 stands at 53 mins
|
Year |
RailYatri’s National Train Delay Index (in minutes) |
|
2015 |
44 |
|
2016 |
45 |
|
2017 |
53 |
Notes -
-
Train delays in 2017 have seen a substantial increase of 20% over the last two years (2015 and 2016)
-
Delay index has been calculated based on the data between January 15 till December 15 of the respective year.
-
Total number of trains considered =
-
Year 2015: 2588 trains
-
Year 2016: 2586 trains
-
Year 2017: 2735 trains
-
-
Total number of stations considered =
-
Year 2015: 3050 stations
-
Year 2016: 3050 stations
-
Year 2017: 3050 stations
-
-
Nationwide: Top 10 stations with least and worst train delays of 2017
Top 10 stations with least delays in 2017
|
No |
Station Code |
Station |
State |
Number of trains tracked |
Train Delay Index (minutes) |
|
1 |
MS |
CHENNAI EGMORE |
Tamil Nadu |
84 |
8 |
|
2 |
MRJ |
MIRAJ |
Maharashtra |
56 |
10 |
|
3 |
VM |
VILLUPURAM |
Tamil Nadu |
95 |
14 |
|
4 |
TPJ |
TIRUCHIRRAPPALLI |
Tamil Nadu |
85 |
15 |
|
5 |
UBL |
HUBLI |
Karnataka |
70 |
15 |
|
6 |
MAS |
CHENNAI CENTRAL |
Tamil Nadu |
173 |
17 |
|
7 |
BSR |
VASAI ROAD |
Maharashtra |
95 |
17 |
|
8 |
INDB |
INDORE JN |
Madhya Pradesh |
64 |
17 |
|
9 |
BVI |
BORIVALI |
Maharashtra |
116 |
18 |
|
10 |
TBM |
TAMBARAM |
Tamil Nadu |
62 |
18 |
Top 10 stations with worst delays in 2017
|
No |
Station Code |
Station |
State |
Number of trains tracked |
Train Delay Index (minutes) |
|
1 |
TDL |
TUNDLA |
Uttar Pradesh |
107 |
181 |
|
2 |
ALJN |
ALIGARH JN |
Uttar Pradesh |
73 |
180 |
|
3 |
BXR |
BUXAR |
Bihar |
90 |
172 |
|
4 |
ANVT |
DELHI ANAND VIHAR |
Delhi |
69 |
171 |
|
5 |
ARA |
ARA |
Bihar |
88 |
165 |
|
6 |
BST |
BASTI |
Uttar Pradesh |
96 |
157 |
|
7 |
ETW |
ETAWAH |
Uttar Pradesh |
63 |
155 |
|
8 |
SV |
SIWAN JN |
Bihar |
68 |
151 |
|
9 |
SLN |
SULTANPUR |
Uttar Pradesh |
56 |
147 |
|
10 |
MFP |
MUZAFFARPUR |
Bihar |
118 |
147 |
Notes -
-
Stations having stops of more than 50 unique trains per week have been considered for the top 10 lists.
-
It is important to note here that the National Train Delay Index for 2017 stands at 53 mins.
-
Stations from Uttar Pradesh and Bihar come in the top 25 stations with the maximum delays. PHAGWARA JN (PGW) from Punjab is the first station from the third state which comes at 38th number with worst delays.
-
State-wise Train Delay Index. Bihar continues to have the highest delays. Gujarat has the lowest.
|
|
State |
Station Count |
Train Delay Index (mins) |
Three Year Delay % Increase |
||
|
2017 |
2016 |
2015 |
||||
|
1 |
Bihar |
256 |
104 |
93 |
80 |
30% |
|
2 |
Uttar Pradesh |
445 |
95 |
87 |
72 |
32% |
|
3 |
Punjab |
106 |
67 |
68 |
64 |
5% |
|
4 |
Goa |
9 |
64 |
54 |
54 |
19% |
|
5 |
Assam |
111 |
62 |
47 |
46 |
35% |
|
6 |
Jharkhand |
106 |
44 |
47 |
21% |
|
|
7 |
Delhi |
27 |
55 |
56 |
52 |
6% |
|
8 |
Haryana |
63 |
55 |
53 |
50 |
10% |
|
9 |
Madhya Pradesh |
213 |
50 |
47 |
48 |
4% |
|
10 |
West Bengal |
172 |
47 |
36 |
37 |
27% |
|
11 |
Uttarakhand |
25 |
46 |
42 |
32 |
44% |
|
12 |
Chhattisgarh |
59 |
44 |
35 |
31 |
42% |
|
13 |
Rajasthan |
195 |
44 |
34 |
30 |
47% |
|
14 |
Telangana |
93 |
43 |
34 |
46 |
(-7%) |
|
15 |
Orissa |
129 |
40 |
29 |
31 |
29% |
|
16 |
Andhra Pradesh |
160 |
39 |
29 |
34 |
15% |
|
17 |
Kerala |
91 |
37 |
31 |
25 |
48% |
|
18 |
Maharashtra |
228 |
36 |
28 |
29 |
24% |
|
19 |
Karnataka |
137 |
31 |
24 |
23 |
35% |
|
20 |
Tamil Nadu |
170 |
25 |
19 |
19 |
32% |
|
21 |
Gujarat |
149 |
24 |
18 |
21 |
14% |
|
22 |
Himachal Pradesh |
3 |
15 |
11 |
6 |
150% |
Notes -
-
Bihar continues to the state where travellers continue to face the maximum delays. At the current rate of increase, it is well possible that the average delay at its stations may cross 2 hrs in few years.
-
Three states – Uttarakhand, Bihar and Kerala – are showing a double digit percentage increase in train delays consecutively over the last two years.
-
In terms of increase of delays spread over three years – the two worst performing states are Rajasthan and Kerala. (nearly 47% increase in 3 years)
-
While its average delay index is still among the top three, Punjab has shown the lowest rate of increase in train delays over the last three years. (only 5% increase in 3 years)
-
Similarly, state of Delhi has shown the second lowest rate of increase in train delays (6% in 3 years)
-
-
In terms of percentage increase in train delays in 2017 – the state of Orissa and Gujarat saw the maximum increase (nearly 28%). However, considering the low average delays in Gujarat, this impact of increase is minimal.
-
In terms of percentage decrease in train delays in 2017 – the state of Punjab and Delhi showed a decrease in delays (by nearly 1.5%).
-
To summarize –
-
Top 5 states with maximum train delays in 2017: Bihar, Uttar Pradesh, Punjab, Goa, and Assam
-
Top 5 states with least train delays in 2017: Gujarat, Tamil Nadu, Karnataka, Maharashtra, and Kerala
-
-
Nation-wide: How have major stations performed over 3 years
|
No |
Station |
State |
Number of trains tracked |
Train Delay Index (mins) |
3-yr Change |
||
|
2015 |
2016 |
2017 |
|
||||
|
1 |
CHENNAI CENTRAL (MAS) |
Tamil Nadu |
173 |
14 |
11 |
15 |
+7% |
|
2 |
NEW DELHI (NDLS) |
Delhi |
238 |
54 |
55 |
54 |
0% |
|
3 |
HOWRAH (HWH) |
West Bengal |
228 |
28 |
29 |
43 |
+54% |
|
4 |
MUMBAI C SHIVAJI TERM (CSTM) |
Maharashtra |
94 |
20 |
16 |
27 |
+35% |
|
5 |
KANPUR CENT (CNB) |
Uttar Pradesh |
319 |
95 |
110 |
113 |
+19% |
|
6 |
BHOPAL (BPL) |
Madhya Pradesh |
226 |
52 |
51 |
60 |
+15% |
|
7 |
PATNA (PNBE) |
Bihar |
168 |
84 |
86 |
91 |
+8% |
|
8 |
JAIPUR (JP) |
Rajasthan |
162 |
26 |
32 |
42 |
+62% |
|
9 |
AHMEDABAD (ADI) |
Gujarat |
252 |
15 |
11 |
18 |
+20% |
|
10 |
SECUNDERABAD (SC) |
Telangana |
154 |
60 |
21 |
57 |
(-5%) |
|
11 |
NAGPUR (NGP) |
Maharashtra |
232 |
30 |
30 |
38 |
+27% |
|
12 |
ALLAHABAD (ALD) |
Uttar Pradesh |
206 |
110 |
115 |
117 |
+6% |
|
13 |
GUWAHATI (GHY) |
Assam |
100 |
46 |
54 |
71 |
+54% |
|
14 |
BENGALURU CENT (SBC) |
Karnataka |
116 |
11 |
16 |
20 |
+82% |
|
15 |
BHUBANESWAR (BBS) |
Orissa |
204 |
39 |
32 |
40 |
+3% |
Notes -
-
It is important to note here that the National Train Delay Index for 2017 stands at 53 mins.
-
Nation-wide: Top 10 stations where significant improvement has been seen in delay reductions over 3 years
|
No |
Station |
State |
Number of trains tracked |
Train Delay Index (mins) |
3-yr improvements |
||
|
2015 |
2016 |
2017 |
|||||
|
1 |
HAPA (HAPA) |
Gujarat |
53 |
78 |
18 |
30 |
62% |
|
2 |
CHANDIGARH (CDG) |
Chandigarh |
64 |
52 |
20 |
24 |
54% |
|
3 |
INDORE (INDB) |
Madhya Pradesh |
64 |
21 |
12 |
16 |
23% |
|
4 |
DAHOD (DHD) |
Gujarat |
74 |
47 |
37 |
37 |
21% |
|
5 |
VRIDHACHALAM (VRI) |
Tamil Nadu |
50 |
28 |
23 |
23 |
20% |
|
6 |
H NIZAMUDDIN (NZM) |
Delhi |
183 |
46 |
45 |
37 |
19% |
|
7 |
ANAKAPALLE (AKP) |
Andhra Pradesh |
51 |
35 |
23 |
29 |
18% |
|
8 |
SIRPUR KAGAHZNAGAR (SKZR) |
Telangana |
89 |
66 |
60 |
55 |
18% |
|
9 |
RATLAM (RTM) |
Madhya Pradesh |
134 |
35 |
28 |
29 |
16% |
|
10 |
PURI (PURI) |
Orissa |
78 |
37 |
26 |
32 |
14% |
Notes -
-
Stations having stops of more than 50 unique trains per week have been considered.
-
Though Gujarat has shown an average improvement of 62%, the delays have increased in 2017 as compared to 2016.
-
Nation-wide: Top 10 stations where delays have significantly increased over 3 years
|
No |
Station |
State |
Number of trains tracked |
Train Delay Index (mins) |
3-yr Increase |
||
|
2015 |
2016 |
2017 |
|
||||
|
1 |
HUBLI (UBL) |
Karnataka |
70 |
3 |
6 |
13 |
294% |
|
2 |
REWARI (RE) |
Haryana |
72 |
9 |
19 |
30 |
237% |
|
3 |
SHORANUR (SRR) |
Kerala |
113 |
9 |
18 |
28 |
209% |
|
4 |
KANNUR (CAN) |
Kerala |
94 |
13 |
23 |
35 |
171% |
|
5 |
PALAKKAD (PGT) |
Kerala |
105 |
11 |
20 |
27 |
143% |
|
6 |
KOZHIKODE (CLT) |
Kerala |
98 |
15 |
24 |
34 |
134% |
|
7 |
GORAKHPUR JN (GKP) |
Uttar Pradesh |
166 |
50 |
75 |
105 |
111% |
|
8 |
RAMPUR HAT (RPH) |
West Bengal |
87 |
17 |
16 |
35 |
107% |
|
9 |
KHALILABAD (KLD) |
Uttar Pradesh |
60 |
61 |
88 |
126 |
106% |
|
10 |
BASTI (BST) |
Uttar Pradesh |
96 |
72 |
107 |
148 |
106% |
Notes -
-
Stations having stops of more than 50 unique trains per week have been considered.
-
Though the delay in stations like Hubli are comparatively low, the trend of increasing delay needs attention.
-
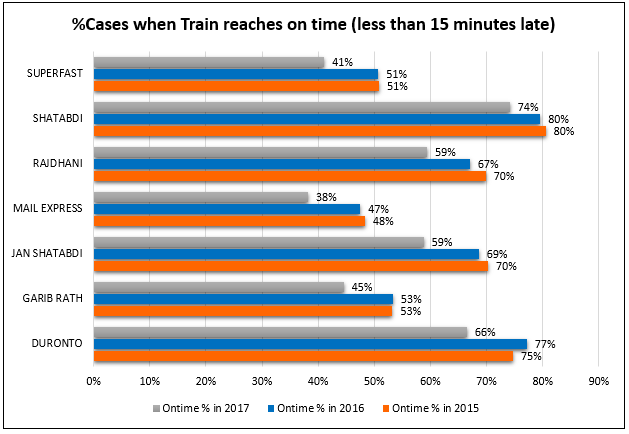
Train Delays by type of the train
|
Year |
No. of trains |
Train Delay Index (mins) |
On-time |
Medium-late |
Very-late |
|
Express/Mail |
|||||
|
2015 |
1222 |
38 |
52.3% |
32.2% |
15.4% |
|
2016 |
1308 |
45 |
50.9% |
32.9% |
16.2% |
|
2017 |
1333 |
56 |
42.3% |
35.1% |
22.6% |
|
3-Year % Change |
+47.6% |
(-19.1%) |
+9.0% |
+46.8% |
|
|
|
|
|
|
|
|
|
Superfast Trains |
|||||
|
2015 |
862 |
47 |
53.1% |
29.7% |
17.2% |
|
2016 |
900 |
50 |
52.9% |
30.2% |
16.9% |
|
2017 |
914 |
60 |
43.3% |
33.5% |
23.2% |
|
3-Year % Change |
+27.6% |
(-18.5%) |
+12.8% |
+34.9% |
|
|
|
|
|
|
|
|
|
Shatabdi |
|||||
|
2015 |
47 |
11 |
82.7% |
14.5% |
2.8% |
|
2016 |
49 |
12 |
81.5% |
15.5% |
3.0% |
|
2017 |
49 |
16 |
75.2% |
19.4% |
5.4% |
|
3-Year % Change |
+45.5% |
(-9.1%) |
+33.8% |
+92.9% |
|
|
|
|
|
|
|
|
|
Rajdhani |
|||||
|
2015 |
46 |
24 |
69.4% |
21.9% |
8.7% |
|
2016 |
46 |
29 |
66.2% |
24.4% |
9.4% |
|
2017 |
46 |
32 |
58.7% |
27.8% |
13.5% |
|
3-Year % Change |
+33.3% |
(-15.4%) |
+26.9% |
+55.2% |
|
|
|
|
|
|
|
|
|
Duronto |
|||||
|
2015 |
54 |
31 |
73.9% |
12.0% |
14.1% |
|
2016 |
56 |
27 |
74.5% |
14.5% |
11.0% |
|
2017 |
56 |
40 |
65.2% |
19.8% |
15.0% |
|
3-Year % Change |
+29.0% |
(-11.8%) |
+65.0% |
+6.4% |
|
|
|
|
|
|
|
|
|
Garibrath |
|||||
|
2015 |
50 |
45 |
57.6% |
28.1% |
14.3% |
|
2016 |
50 |
46 |
55.3% |
28.2% |
16.5% |
|
2017 |
50 |
55 |
48.2% |
30.7% |
21.1% |
|
3-Year % Change |
+22.2% |
(-16.3%) |
+9.3% |
+47.6% |
|
|
|
|
|
|
|
|
|
Jan Shatabdi |
|||||
|
2015 |
37 |
15 |
69.7% |
26.6% |
3.7% |
|
2016 |
37 |
18 |
67.9% |
26.7% |
5.4% |
|
2017 |
37 |
25 |
57.3% |
33.5% |
9.1% |
|
3-Year % Change |
+66.7% |
(-17.8%) |
+25.9% |
+145.9% |
|
Notes -
-
The delays have been classified as follows –
-
On Time = Train delays of <= 15 mins
-
Medium Late = Train delays of 15 – 60 mins
-
Very late = Train delays of more than 60 mins
-
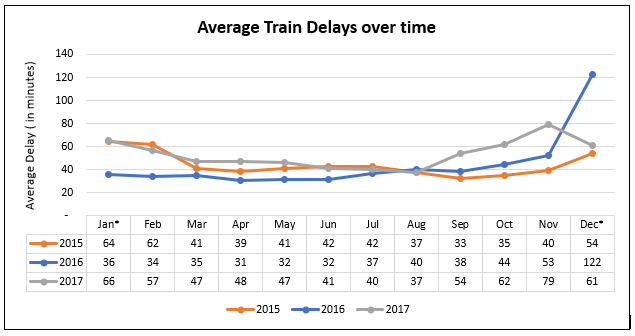
Notes -
-
For the month of January only the delays of dates between 15 and 31 were considered. For the month of December, the dates between 1 and 15 were considered.
-
Delays are seen to increase starting from the month of October and lowers off post February.
-
With an exception of December, every month on 2016 saw a decrease in delays compared to the respective months of the previous year. In 2017 – the train delays were across the year. Every month in 2017 saw an increase of delays of nearly 15-20% over the respective months of 2016.
-
So, does delay increase during the rush period? Below were the dates on which the popular festivals fell in the last three years.
|
|
2015 |
2016 |
2017 |
|
Holi |
March 6 |
March 24 |
March 13 |
|
Raksha Bandhan |
August 29 |
August 18 |
August 7 |
|
Diwali |
November 11 |
October 30 |
October 19 |
|
Chath |
November 17 |
November 6 |
October 26 |
-
There has been an increase in delays of trains during (Puja – Diwali – Chhath) period over the last year. In 2017 the train delays during this period was the highest over the last three years (an increase of nearly 40% over 2016)
-
Fog delays in 2017 has been the worst in the last three years.
|
Time Period |
National Train Delay Index (minutes) |
|
January 1 – 15, 2015 |
72 |
|
December 15 2015 – January 15 2016 |
47 |
|
December 15 2016 – January 15 2017 |
96 |
|
December 15 2017 – January 15 2018 |
87 |
Notes -
-
For the fog of 2014-15, the data between time-frame of Dec 15 – 31, 2014 was not available. So only 15 days data has been considered.
-
State-wise: the stations with least and worst train delays of 2017
|
State |
Station with least delay (2017) |
Station with worst delay (2017) |
||||
|
Station |
Number of trains tracked |
Train Delay Index (mins) |
Station |
Number of trains tracked |
Train Delay Index (mins) |
|
|
Andhra Pradesh |
DUVVADA (DVD) |
73 |
23 |
ADONI (AD) |
56 |
60 |
|
Assam |
KAMAKHYA (KYQ) |
100 |
64 |
KOKRAJHAR (KOJ) |
65 |
97 |
|
Bihar |
RAJENDRANAGAR PATNA (RJPB) |
67 |
73 |
BUXAR (BXR) |
90 |
163 |
|
Chhattisgarh |
DURG (DURG) |
120 |
30 |
BHATAPARA (BYT) |
70 |
43 |
|
Delhi |
DELHI CANTT (DEC) |
69 |
35 |
ANAND VIHAR (ANVT) |
69 |
156 |
|
Gujarat |
SURAT (ST) |
263 |
18 |
MAHESANA (MSH) |
90 |
42 |
|
Haryana |
REWARI (RE) |
72 |
30 |
YAMUNA NAGAR (YJUD) |
52 |
99 |
|
Jharkhand |
RANCHI (RNC) |
68 |
26 |
KODERMA (KQR) |
65 |
98 |
|
Karnataka |
HUBLI JN (UBL) |
70 |
13 |
KARWAR (KAWR) |
52 |
70 |
|
Kerala |
TRIVANDRUM CENT (TVC) |
84 |
18 |
TIRUVALLA (TRVL) |
57 |
48 |
|
Madhya Pradesh |
INDORE (INDB) |
64 |
16 |
HARDA (HD) |
55 |
80 |
|
Maharashtra |
MIRAJ (MRJ) |
56 |
4 |
RATNAGIRI (RN) |
74 |
66 |
|
Orissa |
JHARSUGDA (JSG) |
90 |
30 |
TITLAGARH (TIG) |
55 |
52 |
|
Punjab |
PATHANKOT CANTT (PTKC) |
85 |
74 |
PHAGWARA JN (PGW) |
81 |
106 |
|
Rajasthan |
AJMER (AII) |
115 |
33 |
BHARATPUR (BTE) |
79 |
73 |
|
Tamil Nadu |
CHENNAI EGMORE (MS) |
84 |
6 |
VIRUDUNAGAR JN (VPT) |
53 |
38 |
|
Telangana |
KACHEGUDA (KCG) |
51 |
27 |
RAMGUNDAM (RDM) |
76 |
64 |
|
Uttar Pradesh |
MANIKPUR (MKP) |
70 |
51 |
ALIGARH JN (ALJN) |
73 |
166 |
|
Uttarakhand |
HARIDWAR (HD) |
66 |
42 |
LAKSAR JN (LRJ) |
68 |
101 |
|
West Bengal |
SANTRAGACHI (SRC) |
76 |
27 |
KISHANGANJ (KNE) |
125 |
105 |
Notes -
-
Stations having stops of more than 50 unique trains per week have been considered.
-
It is important to note here that the National Train Delay Index for 2017 stands at 53 mins.
-
In the following three states – even the station with lowest delay is higher than the National Train Delay Index – Assam, Bihar, and Punjab.
-
There are only three states where all the station delays fall below the National Train Delay Index are: Gujarat, Kerala, and Tamil Nadu
-
Nation-wide: Trains with maximum delays in 2017
|
No |
Train Number |
Train Name |
2017 |
2016 Train Delay Index |
2015 Train Delay Index |
|||
|
Train Delay Index |
On-time |
Medium Late |
Very Late |
|
|
|||
|
1 |
12598 |
Mumbai CST – Gorakhpur Jansadharan Exp |
1059 mins |
0 |
0 |
100% |
287 mins |
212 mins |
|
2 |
22405 |
Bhagalpur – Anand Vihar Garib Rath |
662 mins |
3% |
5% |
92% |
497 mins |
414 mins |
|
3 |
13282 |
Rajendra Nagar Patna – New Tinsukia Weekly Exp |
613 mins |
2% |
4% |
94% |
341 mins |
185 mins |
|
4 |
12597 |
Gorakhpur - Mumbai CST Jansadharan Exp |
607 mins |
6% |
7% |
87% |
119 mins |
126 mins |
|
5 |
15654 |
Jammutawi – Guwahati Amarnath Exp |
601 mins |
1% |
2% |
97% |
303 mins |
190 mins |
|
6 |
12524 |
New Delhi – New Jalpaiguri Superfast |
597 mins |
1% |
1% |
99% |
291 mins |
141 mins |
|
7 |
12562 |
New Delhi – Jaynagar Swantra Sainani Superfast |
597 mins |
2% |
1% |
96% |
393 mins |
265 mins |
|
8 |
15602 |
New Delhi – Silchar Poorvotar Sampark Kranti |
587 mins |
2% |
1% |
97% |
534 mins |
- |
|
9 |
13238 |
Kota – Patna Express |
554 mins |
1% |
3% |
96% |
219 mins |
135 mins |
|
10 |
22406 |
Anand Vihar – Bhagalpur Garib Rath |
542 mins |
4% |
8% |
88% |
463 mins |
354 mins |
Notes -
-
The delays have been classified as follows –
-
On Time = Train delays of <= 15 mins
-
Medium Late = Train delays of 15 – 60 mins
-
Very late = Train delays of more than 60 mins
-
-
2017: Top 5 Rajdhani trains with maximum delays.
|
No |
Train Number |
Train Name |
2017 |
2016 Train Delay Index |
2015 Train Delay Index |
|||
|
Train Delay Index |
On-time |
Medium Late |
Very Late |
|
|
|||
|
1 |
22824 |
New Delhi – Bhubaneswar Rajdhani |
114 mins |
39% |
28% |
33% |
76 mins |
63 mins |
|
2 |
22812 |
New Delhi – Bhubaneswar Rajdhani (Via Adra) |
108 mins |
39% |
31% |
29% |
108 mins |
52 mins |
|
3 |
12306 |
New Delhi – Howrah Rajdhani (Via Patna) |
74 mins |
49% |
29% |
21% |
58 mins |
21 mins |
|
4 |
12424 |
New Delhi – Dibrugarh Town Rajdhani |
70 mins |
28% |
29% |
43% |
60 mins |
44 mins |
|
5 |
12314 |
New Delhi – Sealdah Rajdhani |
67 mins |
50% |
25% |
26% |
72 mins |
52 mins |
-
2017: Top 5 Duronto trains with maximum delays.
|
No |
Train Number |
Train Name |
2017 |
2016 Train Delay Index |
2015 Train Delay Index |
|||
|
Train Delay Index |
On-time |
Medium Late |
Very Late |
|
|
|||
|
1 |
12282 |
New Delhi – Bhubaneswar Duronto |
344 mins |
2% |
2% |
96% |
229 mins |
202 mins |
|
2 |
12274 |
New Delhi – Howrah Duronto |
266 mins |
7% |
4% |
90% |
108 mins |
52 mins |
|
3 |
12260 |
New Delhi – Sealdah AC Duronto |
175 mins |
14% |
6% |
79% |
58 mins |
21 mins |
|
4 |
12270 |
H Nizamuddin – Chennai Cent Duronto |
155 mins |
27% |
24% |
49% |
126 mins |
28 mins |
|
5 |
12281 |
Bhubaneswar – New Delhi Duronto |
95 mins |
27% |
28% |
44% |
72 mins |
116 mins |
-
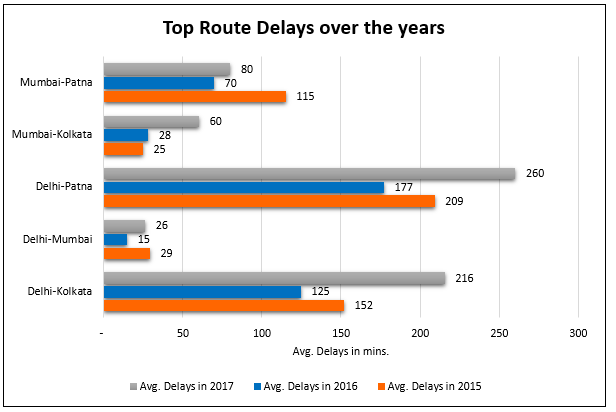
Delay Index by routes between popular cities
|
City Pair A ↔ B |
Delay Index for UP Trains (A → B) (mins) |
Delay Index for DOWN Trains (B → A) (mins) |
||||||
|
2015 |
2016 |
2017 |
3-yr change |
2015 |
2016 |
2017 |
3-yr change |
|
|
Delhi ↔ Guwahati |
298 |
292 |
443 |
+48.7% |
313 |
335 |
386 |
+23.3% |
|
Delhi ↔ Kolkata |
152 |
125 |
216 |
+42.1% |
200 |
193 |
232 |
+16.0% |
|
Delhi ↔ Mumbai |
29 |
15 |
26 |
(-10.3%) |
48 |
40 |
51 |
+6.25% |
|
Mumbai ↔ Amritsar |
59 |
41 |
74 |
+25.4% |
40 |
43 |
69 |
+72.5% |
|
Chennai ↔ Kolkata |
42 |
23 |
31 |
(-26.2%) |
43 |
17 |
35 |
(-18.6%) |
|
Kolkata ↔ Guwahati |
27 |
29 |
91 |
+237.0% |
28 |
27 |
80 |
+185.7% |
|
Bengaluru ↔ Kolkata |
39 |
34 |
55 |
+41.0% |
30 |
34 |
68 |
+126.7% |
|
Mumbai ↔ Bengaluru |
35 |
40 |
79 |
+125.7% |
21 |
15 |
38 |
+81% |
|
Mumbai ↔ Kolkata |
25 |
28 |
60 |
+140% |
30 |
27 |
45 |
+50% |
|
Delhi ↔ Patna |
209 |
177 |
260 |
+24.4% |
130 |
83 |
134 |
+3.1% |
|
Mumbai ↔ Patna |
115 |
70 |
80 |
(-30.4%) |
44 |
34 |
70 |
+59.1% |
|
Chennai ↔ Mumbai |
27 |
17 |
35 |
+29.6% |
12 |
4 |
15 |
+25.0% |
|
Delhi ↔ Bikaner |
7 |
9 |
17 |
+142.9% |
30 |
18 |
20 |
(-33.3%) |
|
Delhi ↔ Jammu- tawi |
29 |
24 |
36 |
+24.13% |
40 |
50 |
35 |
(-12.5%) |
|
Delhi ↔ Kanpur |
105 |
105 |
143 |
+36.2% |
31 |
50 |
46 |
+48.4% |
|
Mumbai ↔ Hyderabad |
62 |
41 |
61 |
(-1.6%) |
23 |
26 |
27 |
(+17.4%) |
|
Kolkata ↔ Patna |
50 |
61 |
93 |
+86% |
69 |
38 |
58 |
(-15.9%) |
|
Mumbai ↔ Varanasi |
66 |
48 |
58 |
(-12.1%) |
57 |
38 |
81 |
+42.1% |
-
Next time you sit in the train, remember - longer the train route distance, more are the delays!
|
Train Distance Category |
Trains Count |
National Train Delay Index - 2017 |
On time (%) |
Medium Late (%) |
Very Late (%) |
|
100-500 kms |
731 |
27 |
57.6 |
32.2 |
10.3 |
|
501-1000 kms |
691 |
43 |
43.8 |
37.9 |
18.3 |
|
1001 -2000 kms |
796 |
83 |
36.7 |
31.9 |
31.4 |
|
> 2000 kms |
351 |
73 |
36.7 |
32.3 |
30.9 |
Notes -
-
The delays have been classified as follows –
-
On Time = Train delays of <= 15 mins
-
Medium Late = Train delays of 15 – 60 mins
-
Very late = Train delays of more than 60 mins
-
-
Nearly half of the long-distance trains in India run 1000 kms and higher. Only one-third of them arrive at the station on-time. However, for the trains which runs less than 1000 kms, the percentage of trains arriving on -time increases to nearly 50%.
-
The chances of train running late by more than 60 mins nearly doubles when the running distance of the train (from start station to end) is more than 1000 kms.
-
Is train delay a function of number of trains at a station?
|
Unique Trains/week |
Nationwide Station Count |
Train Delay Index (minutes) |
3 Year Change |
|||
|
2017 |
2016 |
2015 |
||||
|
0 - 20 |
2175 |
47 |
42 |
40 |
+17.5% |
|
|
21 - 50 |
446 |
57 |
49 |
45 |
+26.7% |
|
|
51 - 200 |
313 |
58 |
49 |
45 |
+29.2% |
|
|
200 - 500 |
19 |
61 |
53 |
51 |
+19.6% |
|
-
Is train delay a function of being a junction station?
|
Station Type |
Nationwide Station Count |
Train Delay Index (minutes) |
Three-year change |
||
|
2017 |
2016 |
2015 |
|
||
|
Junction |
310 |
56 |
48 |
44 |
+27.3% |
|
Non-Junction |
2659 |
49 |
44 |
41 |
+19.5% |